|
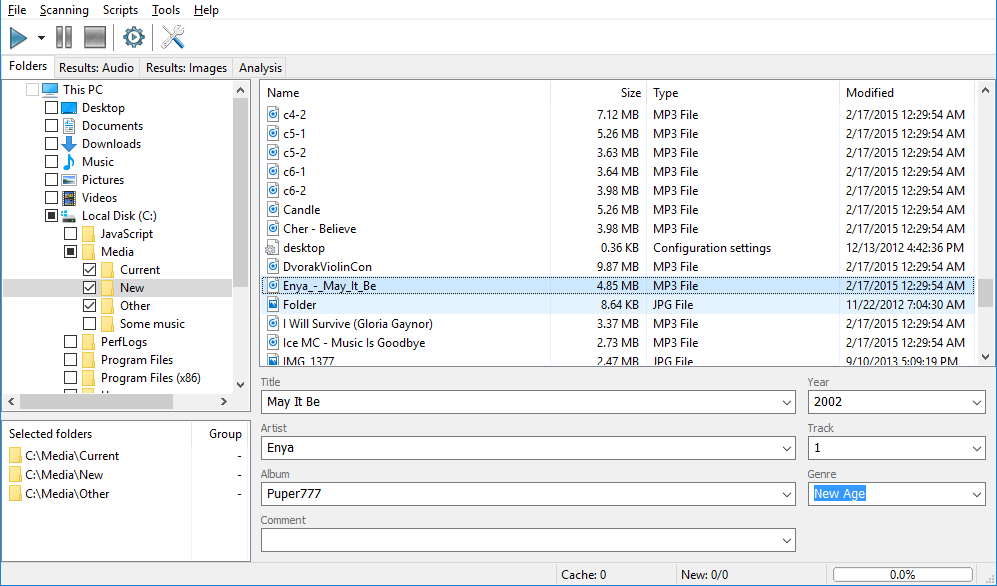
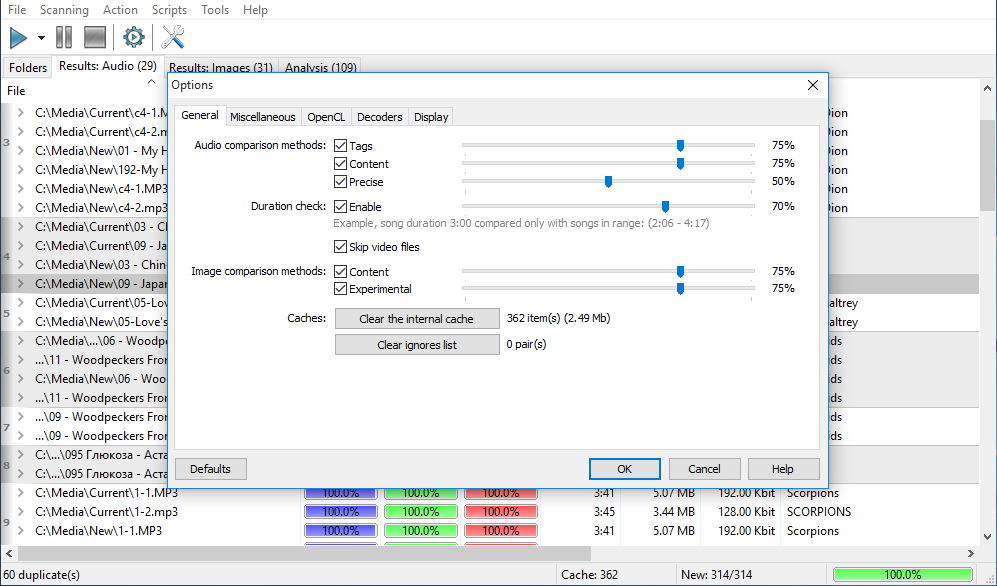
Musical Composition Analysis with Similarity Similarity has very advanced musical composition analysis system, and it gets improved even more with every new version. Such possibility is indispensable for almost any music fan that loves quality sound and tends to listen quality music as well. We have to admit, that the bulk of music files available in Internet has some quality drawbacks: a low bitrate or some quality issues, or encoding artifacts. Similarity allows you to analyze enormous amounts of files simultaneously, without the need to look at each individual file. It summarizes the data into a final report. To run the file analysis you should:
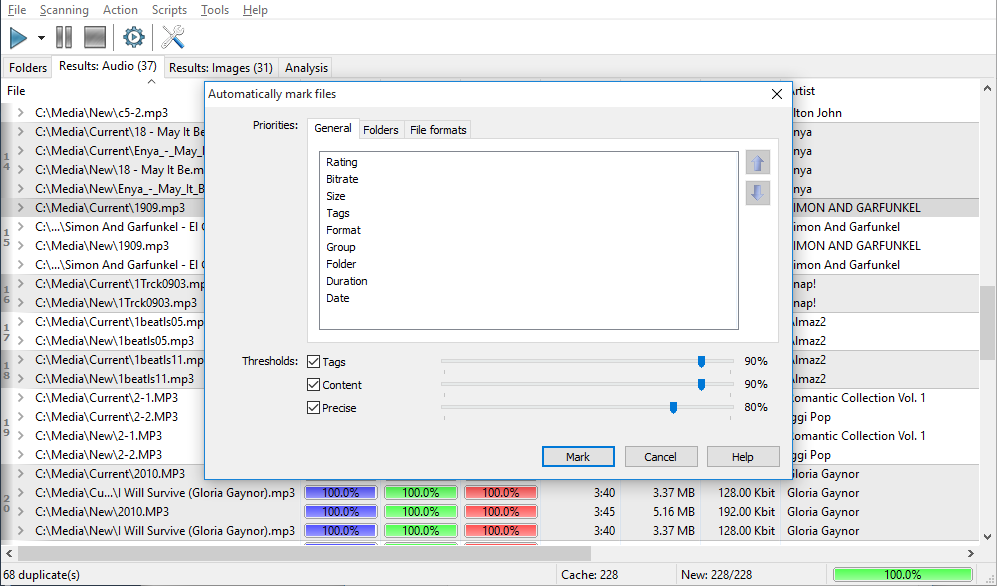
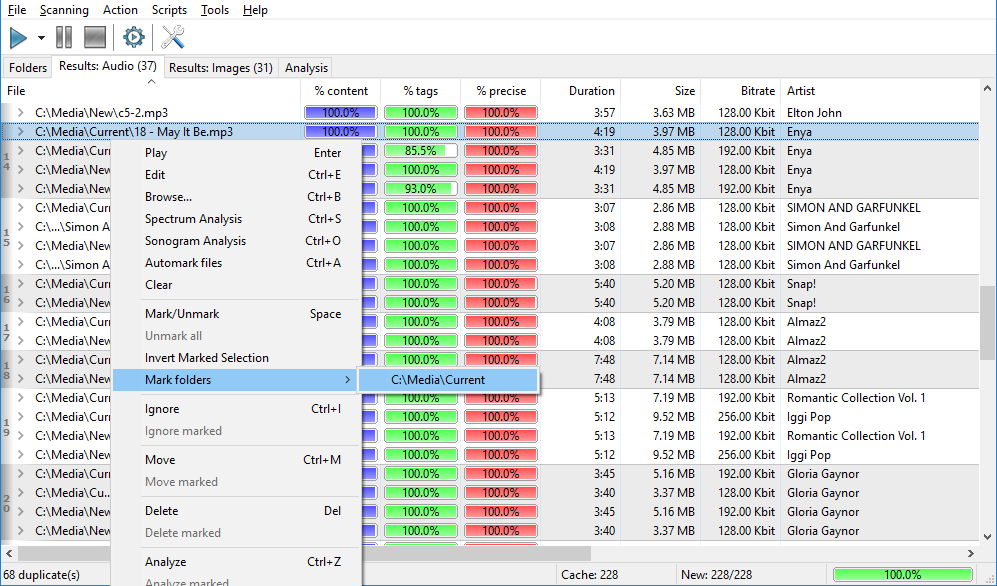
We should mention that the analysis mechanism is much more complex than a simple duplicate search, because it requires each file to be fully decoded to gather full statistics on it. Now let’s take a closer look at the result table. It contains plenty of information about your files. Note, you can sort the table for any field – this is utterly convenient, and provides additional ways to find bad quality compositions according to different criteria, not only by an overall rating. Fields exceeding threshold values suggested by the program are marked with red color and the bold font. Premium version users can see a detailed spectrogram and micro-spectrograms in the table, which provides wide options to find low quality compositions. 
Rating
A complex characteristic calculated from the values of other fields. Read below to learn what fields are included into the calculation.
Size
File size on a hard drive. Isn’t included into the rating calculation.
Sample rate
Sampling frequency, that is, how many times per second sound amplitude values were recorded during the discretization process. For instance, the quality of CD-disks is 44 100 Hz, radio has 22 050 Hz, the higher – the better. However, too high values do not make much sense, because the quality gained that way would not justify increased requirements to a file size. The field is included into the rating calculation. The default worst value (marked with red color) is less or equal to 22050 Hz.
Bitrate
Average amount of bits carrying sensible information per second. The value the actual sense of this parameter may be different for different codecs and encoding methods, so you should only compare it if the codec and the encoding methods (VBR/CBR) match. The field is included into the rating calculation. The default worst value (marked with red color) is less or equal to 64000.
Channels
The number of channels used. It is usually Mono or Stereo. The field is included into the rating calculation. The default worst value (marked with red color) is mono.
Duration
The actual duration of a composition after decoding. Isn’t included into the rating calculation.
Clipping
This parameter reflects the distortion of the amplitude, when a source input signal gets beyond the limits of the allowable range of an output signal. This parameter is crucial. High values of this field most likely tell about wrong remastering or conversion, or low-quality source music file recording. Once again: pay a close attention to this parameter, because many music files downloaded from Internet have problems with it. The field is included into the rating calculation. The default worst value (marked with red color) is more or equal to 100.
Silence
The number of silent blocks in the beginning and in the end of a composition. Isn’t included into the rating calculation.
Mean(Abs.)
An absolute value of the average amplitude value; lies between 0 and 1. This is a sound normalization parameter. High values indicate the lost of dynamic range in one of the polarities. The field is included into the rating calculation. The default worst value (marked with red color) is more or equal to 0.1.
Step
The minimal step between two consequent readings of the amplitude. It is significant to control the bit capacity of a discretization. For example, a correct 16-bit discretization should have 1/(2^15)=0,000030517578125, while an 8-bit one should have 1/(2^7)=0,0078125. The field is included into the rating calculation. The default worst value (marked with red color) is more or equal to 0.00004.
Max(abs.)
An absolute value of the maximum amplitude in a composition. Values lie between 0 and 1. This parameter is extremely important, because it shows if the available dynamic range used in full or not. Quality compositions have the value of this parameter close to 1. This parameter being decreased two times means that 1-bit of discretization is lost. For example, the value 0.48 of this parameter for a 16-bit sample tells that in fact its dynamic range corresponds to 15-bit sample only. Warning: sometimes while remastering CD-disks tracks with reduced dynamic range are found. That’s because sometimes one may need to reduce dynamic range to make some compositions sound more quietly. Anyway, this lead to the loss of quality, however, sometimes this is required. The field is included into the rating calculation. The default worst value (marked with red color) is less or equal to 0.25.
Max Freq.
This is a maximum frequency according to the algorithm of the program. It is worth mentioning that while encoding a file with lossy compression algorithms and a low bitrate, a part of high-frequency information may be lost. You may find such artifacts even in files encoded with lossless codecs and with high bitrates,if a source file was coded with low bitrate. We strongly recommend checking potentially problematic files with spectral analysis, as it provides much more detailed information. The field is included into the rating calculation. The default worst value (marked with red color) is less or equal to 12,000.
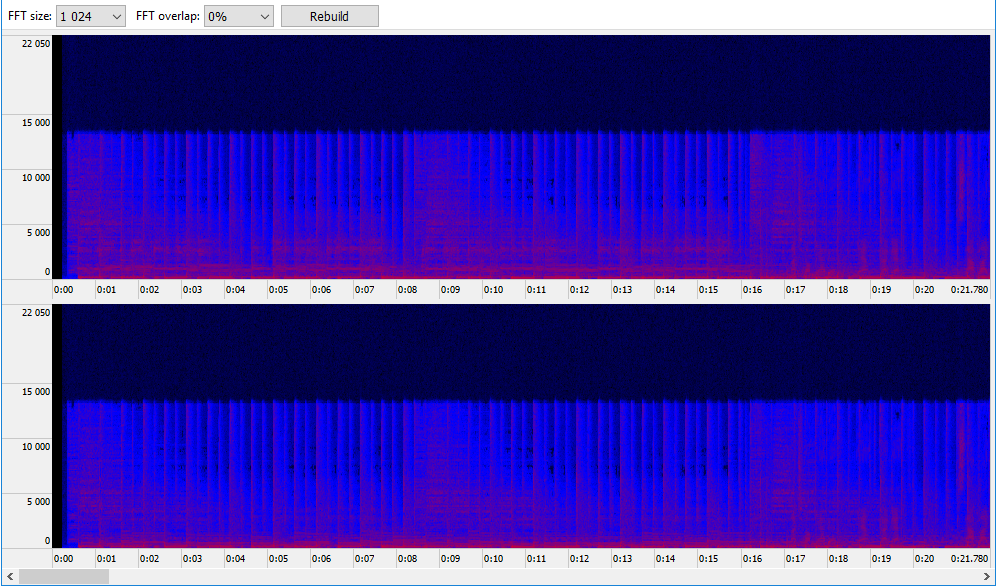
Spectrum
A small spectrogram to visually monitor frequencies used. It displays maximal and average values. This function is available in the Premium version. Isn’t included into the rating calculation.
Clicks
This value shows vinyl discs acoustic distortion. For compositions obtained/remastered from vinyl disks this value is high. Isn’t included into the rating calculation. Spectral Analysis 
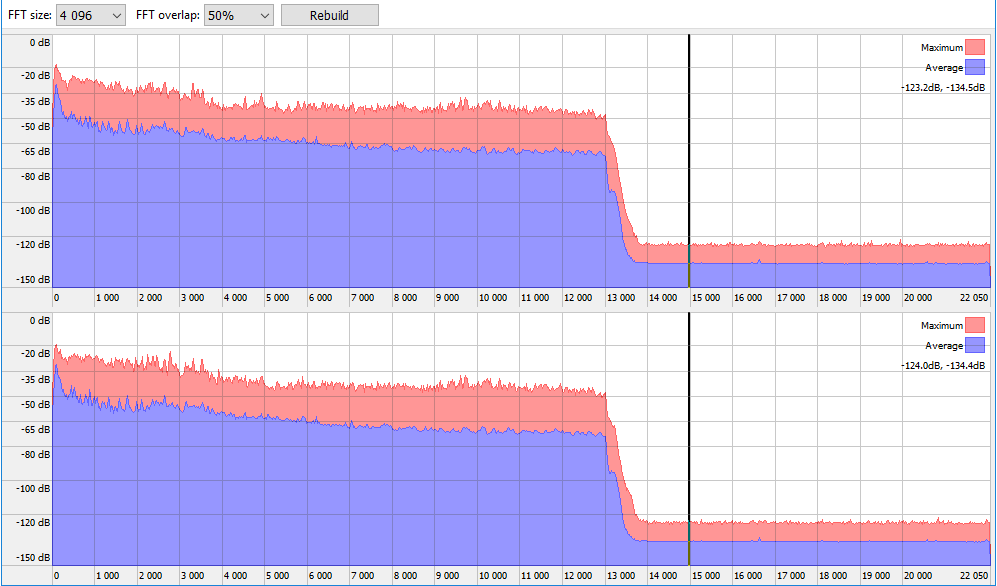
This form of analysis is only available in the Premium version. This analysis shows the detailed graph of frequencies used in a musical file. You can run this analysis from the duplicates context menu too. The vertical axis is logarithmic and is graduated in decibels, because a logarithmic estimation of sound of more peculiar to the human ear. Reducing the volume by 6 dB corresponds to reducing of its absolute value two times, however the human hears this sound not as two times quiet, but decreased to some constant value. That’s why a logarithmic scale is commonly used. 0 dB is an origin, that is, the absolute maximum with full energy. 
You can adjust the parameters of FFT (Fast Fourier Transformation), the number of reference points to calculate FFT and FFT overlapping (overlapping of previous values; 0% means all values are new, 90% means only 10% of values are new, while the other 90% are previous ones). Using these values may lead to higher frequency detalization, or on the contrary, lead to more averaged values. The spectral analysis is performed with averaging (the blue graph) and by maximum (the red graph). For a stereo signal, two different graphs are plotted, for the left and the right channels accordingly. 
For instance, let’s take a "problematic" file with 320 Kbit bitrate and plot its spectrogram. 
We can see a sharp drop on high frequencies. This tells us that the file was probably initially encoded with low bitrate that had led to complete lost of information about high frequencies. Then the file was recoded with higher bitrate which didn’t make it any better, of course. Avoid such files, and use powerful Similarity features (in this case – a spectral analysis) to detect them. In conclusion, we hope you liked this article. Don’t listen and don’t download low-quality music. Internet is overwhelmed with colossal amounts of music distorted in this or that way. These distortions won’t let you to enjoy you favorite music in full with hi-fi acoustics and a quality headset. If you have any questions, please don’t hesitate to contact us at [email protected]. |
Downloads
Premium version
Latest news
2021-11-17 Version 2.5.1 released2020-10-28 Version 2.4.4 released (Mac)2020-09-19 Beta 2.5.0 available2019-11-15 Version 2.4.3 released (Mac)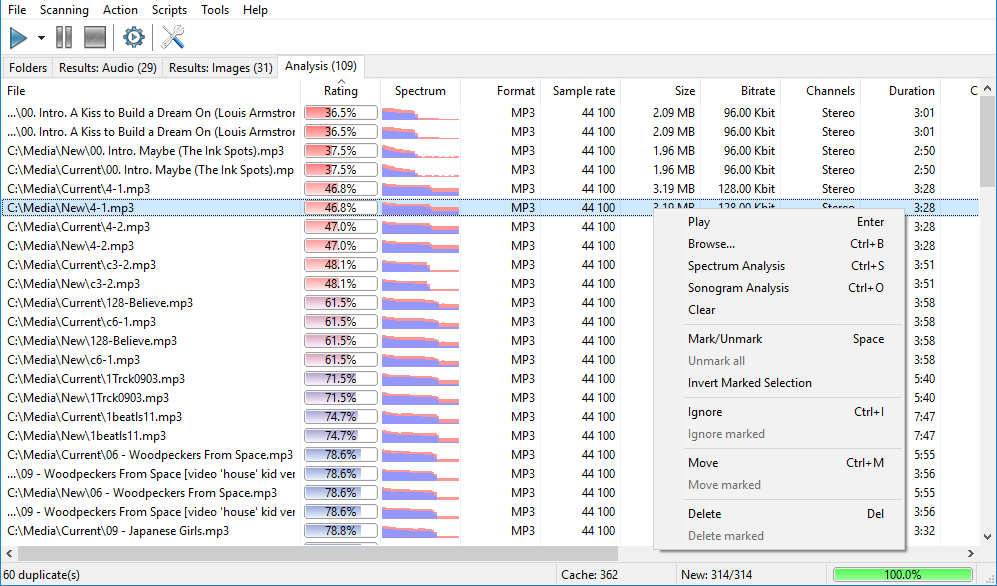
|